

As time goes by, I realized that it’s fun to do flashback every a little while, just to see what you’ve already accomplished along the way, to review what things are okay, what need more improvement, and so on. (btw, have you guys read about our 2017 Blog Summary? see here)
I always like things like contemplating and such. But, not all the time! Just in an enough amount so you enjoy the nostalgic a little bit, but not the bad things. No good thing come from digging the past, believe me. Yours is today. Not the past nor the future. Same with that, imagining the future in the right amount will give you hopes and chances; it’s kind of easing your mind that some good days will come, even if something is not okay today. But again, no good thing come from imagining too much. Yours is today; give a pinch of sweet from past and a sprinkle of hope for future to bear with it, that’s it. Live for today.
Well, it’s 2019 already. Let’s take a look at who we’ve met through this blog on 2018!
General
Since being made on August 2016, this blog, Panda Bear Journey (PBJ) is 2,5 years old now. Its spreading on internet has increased through years.
On 2016 (Aug – Dec), its visitor = 54 and number of views = 91. PBJ was visited by people from 16 countries.
On 2017 (Jan – Dec), its visitor = 1077 and number of views = 1817.
PBJ was visited by people from 59 countries.
Last year, on 2018 (Jan – Dec), its visitor = 2139 and number of views = 3095.
PBJ was visited by people from 72 countries.

Continent
Below is the last year statistics (2018), divided by Continent. Most visitors came from Asia. It then followed by visitors from America, Europe, Australia, and Africa in orderly.

Note :
I present the data on 2 ways. First, total amount of views, which is stated after every label, and written bold. Second, its percentage among everything, which stated after the amount. To simplify the appearance, if the percentage < 1%, i don’t put the percentage number on the graphs, but still write the amount of views.
Asia

Now let’s break down the Asian countries. Top 8 countries who visited PBJ are: Malaysia (surprisingly not Indonesia), followed by Vietnam, Indonesia, Singapore, India, Japan, Thailand, and Philippines. Another Asia countries that made a visit are: Hongkong, Brunei, Pakistan, Taiwan, South Korea, UAE, Cambodia, Israel, Saudi Arabia, Myanmar, Bangladesh, Kuwait, Uzbekistan, Sri Lanka, Jordan, Nepal, China, Oman, and Qatar.
America
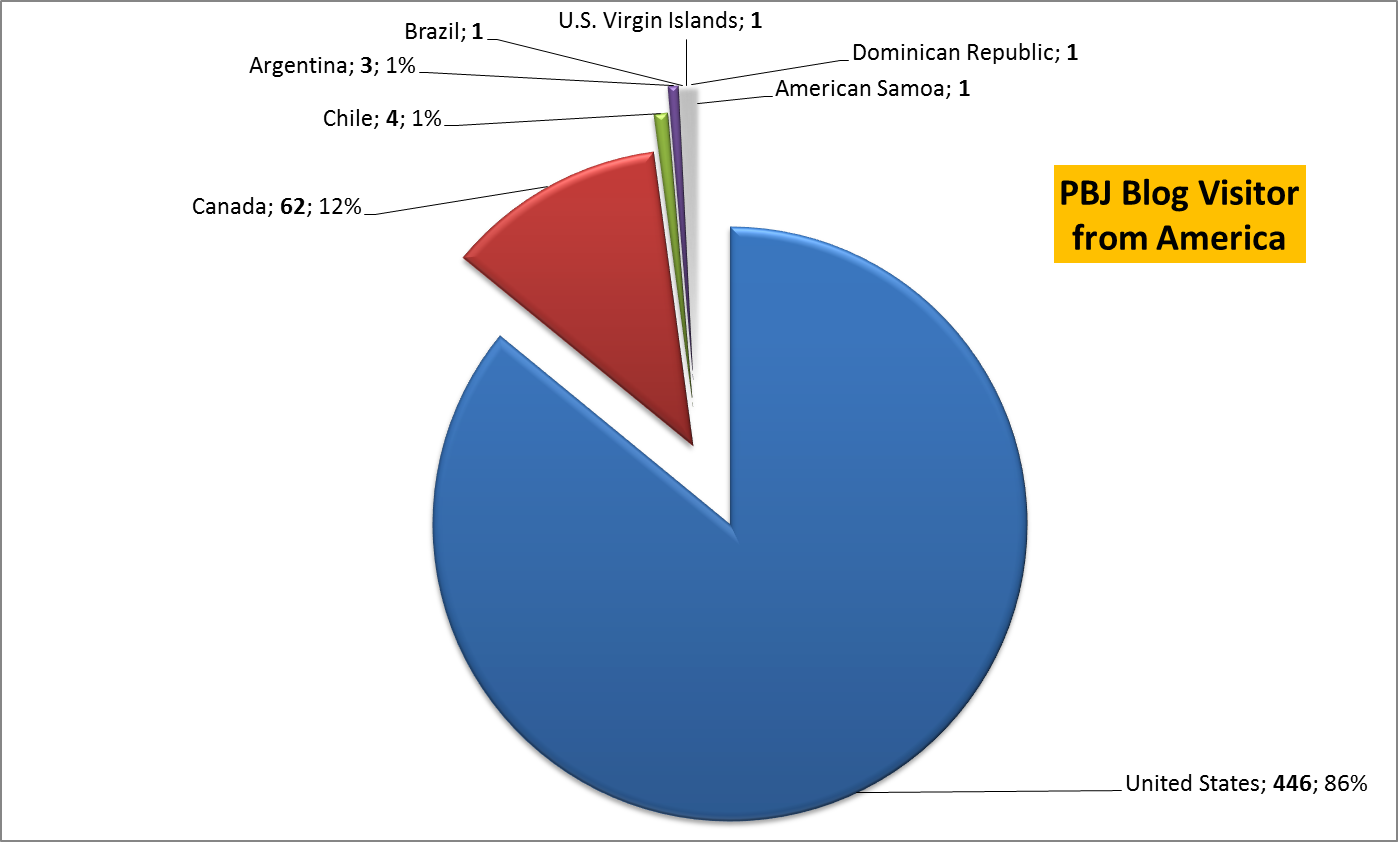
Let’s take a look at American countries. Top 2 countries who visited PBJ are: USA and Canada. Another American countries that made a visit are: Chile, Argentina, Brazil, Virgin Islands, Dominican Republic, and Samoa Island.
Europe

Moving on to European countries. Top 7 countries who visited PBJ are: Germany, UK, Spain, Switzerland, Finland, Austria, and Norway. Another European countries that made a visit are: Belgium, Netherlands, France, Poland, Russia, Sweden, Czech Republic, Hungary, Turkey, Denmark, Portugal, Ukraine, Ireland, Italy, Romania, Bulgaria, Albania, European Union, Estonia, Greece, Lithuania, and Moldova.
Australia

Well, from Australian countries, there are visitors from Australia and New Zealand.
Africa
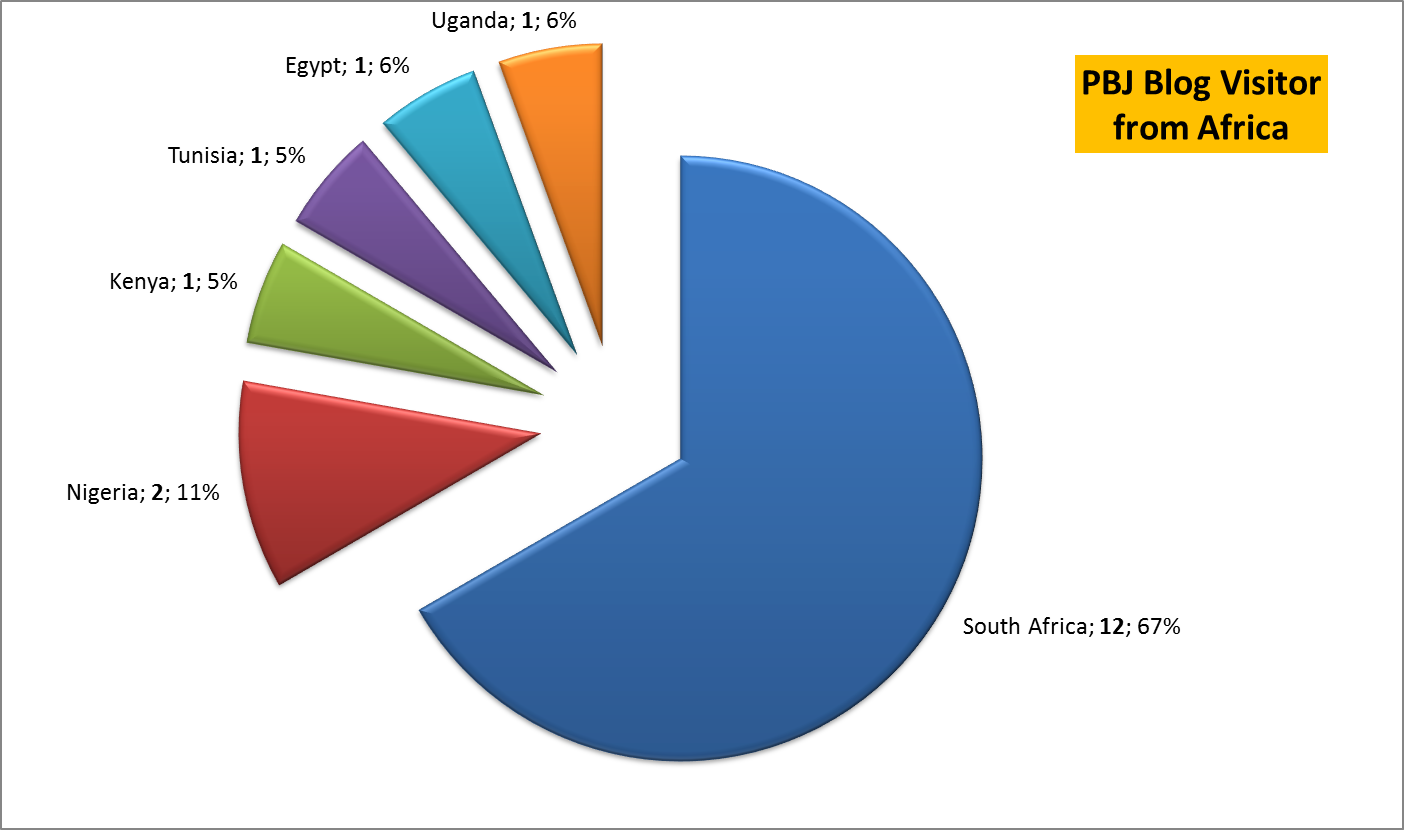
Top PBJ visitors from African countries is South Africa. Another African countries that made a visit are: Nigeria, Kenya, Tunisia, Egypt, and Uganda.
To the Next Adventure…
Goodbye, 2018! It’s such an improvement, indeed! Well, we’ll try to be better from time to time, whether on writing the blog posts or on the adventure itself. Thank you for visiting, everyone! 🙂 Hope the stories here can inspire you somehow and or useful for your trip. We can’t wait to step our little feet on to another new land on this enormous Earth! See you guys along the way! 🙂

Such a cool and in depth analysis! How did you do the pie charts, did you have Google Analytics or create them yourself? Really useful! I also find it fascinating how the audience location differs from blog to blog.
It is great to see your blog grow year by year, keep it up 🙂
LikeLiked by 1 person
Thank you to stopping by! I created the pie charts by myself using Microsoft Excel. Not obsessive, just so into it, lol… Yeah, the audience varied a lot… Since i’m iving in Asia, i find it’s very fascinating to know that somebody from Africa come by to my blog… 🙂
Btw, how did you achieved so many followers and views on your blog? Did you use adsense or put many tags on each post (is this affect the search on google?) or something else?
LikeLiked by 1 person
I wish I was as good with Excel haha, since school my skills have dwindled. You have people from all over the world stopping by which is great 🙂
I have achieved this following by working on my blog for a few hours each day, really it is down to just the amount of time I am on it and getting my name out there as much as possible. Liking, commenting, reading blogs all notifies people of your blog and is a great way to have conversation and it was only after I started being more ‘full time’ here that I started to see a significant change 🙂
LikeLiked by 1 person